Figure 5
Download original image
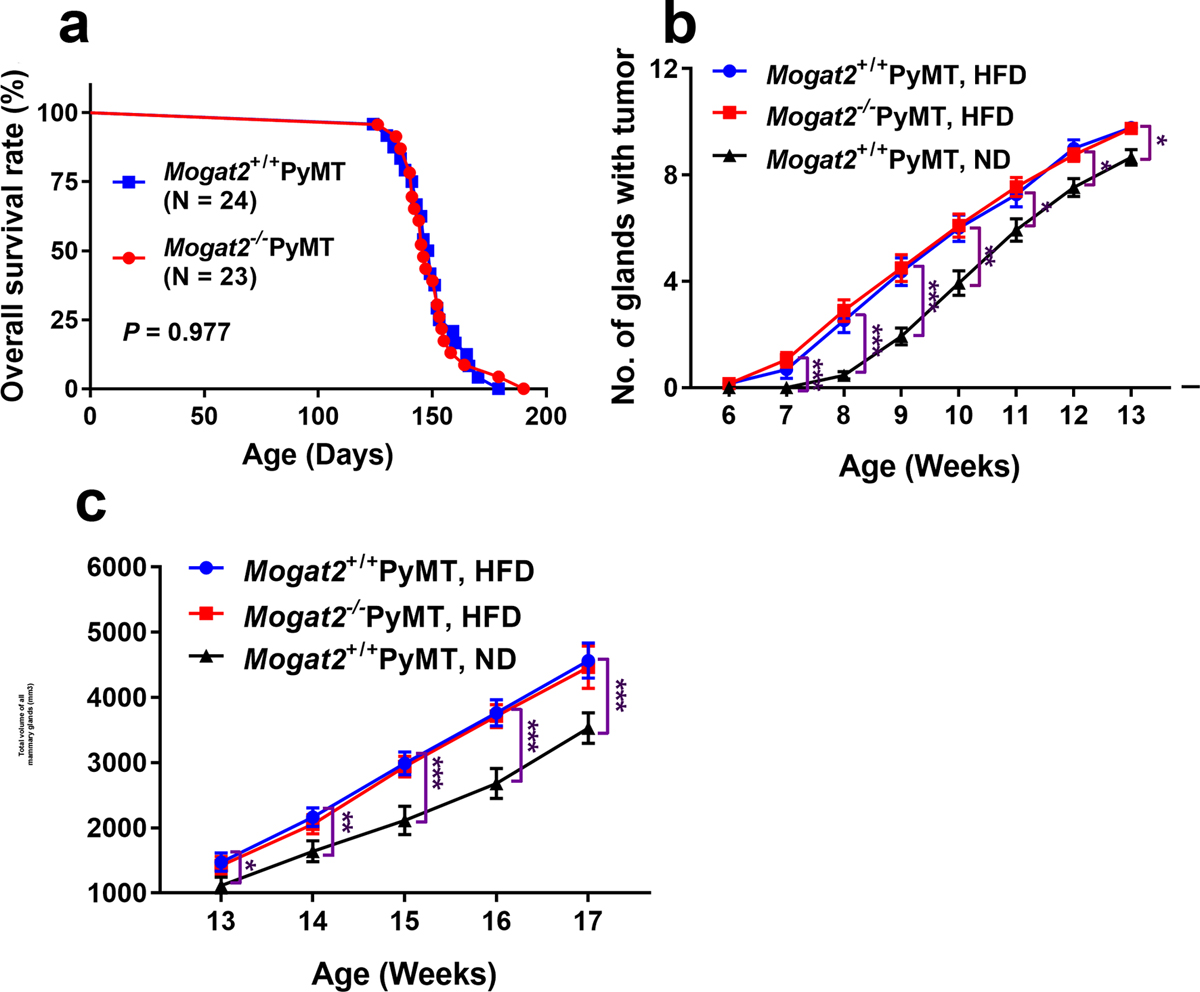
Mammary tumor progression is accelerated by a high-fat diet regardless of Mogat2 gene depletion. (a) Kaplan–Meier curves showing the overall survival of Mogat2+/+PyMT (n = 24) and Mogat2−/−PyMT (n = 24) mice. Data were analyzed by the log-rank test. The mice were fed on a normal diet. (b) The appearance of mammary tumors in Mogat2+/+PyMT (n = 19) and Mogat2−/−PyMT (n = 20) mice fed with a high-fat diet (37% of calories from fat), and Mogat2+/+PyMT (n = 15) fed on a normal diet were monitored by weekly palpation and are represented on Kaplan–Meier curves. (c) The tumor volume of all mammary glands was determined in Mogat2+/+PyMT (n = 10) and Mogat2−/−PyMT (n = 10) mice fed on a high-fat diet, as well as Mogat2+/+PyMT (n = 10) mice fed on a normal diet which were measured weekly at 13–17 weeks old. Data represent the mean ± SEM. NS, non-significant; HFD, high-fat diet; ND, normal diet. *P < 0.05. **P < 0.01. ***P < 0.001.
Current usage metrics show cumulative count of Article Views (full-text article views including HTML views, PDF and ePub downloads, according to the available data) and Abstracts Views on Vision4Press platform.
Data correspond to usage on the plateform after 2015. The current usage metrics is available 48-96 hours after online publication and is updated daily on week days.
Initial download of the metrics may take a while.