Figure 2
Download original image
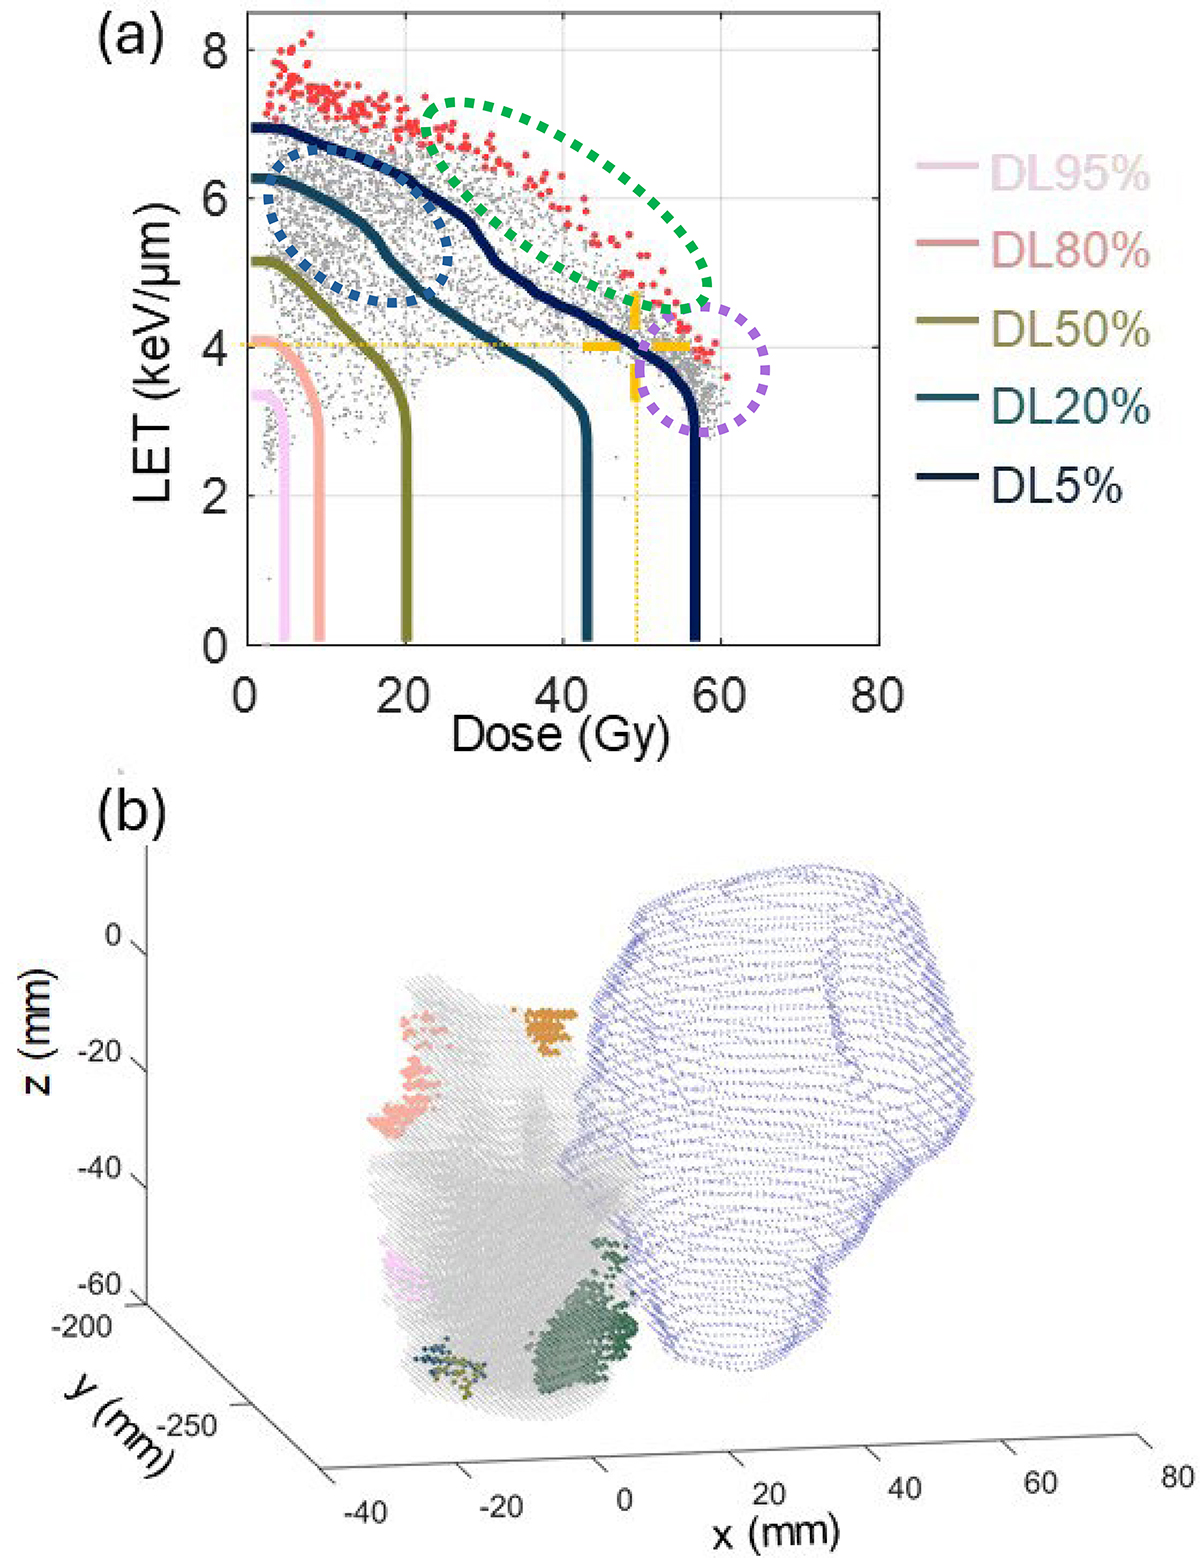
An example of the dosimetric seed spot analysis in the voxel-level adverse event analysis. (a) Dose linear-energy-transfer (LET) volume histogram (DLVH) of an adverse event (AE) region in one head-and-neck (H&N) patient. The grey dots represent voxels of the structure. The solid lines are the iso-volume contour lines DLν% of the DLVH. The assumed critical voxels for seed spot analysis are represented by the red dots, which are the highest 5% LET voxels selected from each dose bin within the moderate to high dose range. Potential voxels influenced by biological effects in in-field AE regions with low doses and low LET are enclosed within the light blue dashed oval. The purple dashed circle and green dashed oval respectively denote possible voxels in in-field AE regions typically characterized by high doses, and out-of-field AE regions typically characterized by high LET. (b) Identification of seed spots within an AE region. The spatial distribution of seed spots is shown for mandibular osteoradionecrosis in a representative patient. Critical voxels in DLVH are identified and grouped into four seed spots, each highlighted in a different color. Other AE voxels are depicted in gray, while the high-dose clinical target volume (CTVHigh) is shown in blue. The figure is presented in DICOM coordinates.
Current usage metrics show cumulative count of Article Views (full-text article views including HTML views, PDF and ePub downloads, according to the available data) and Abstracts Views on Vision4Press platform.
Data correspond to usage on the plateform after 2015. The current usage metrics is available 48-96 hours after online publication and is updated daily on week days.
Initial download of the metrics may take a while.