Open Access
Figure 1
Download original image
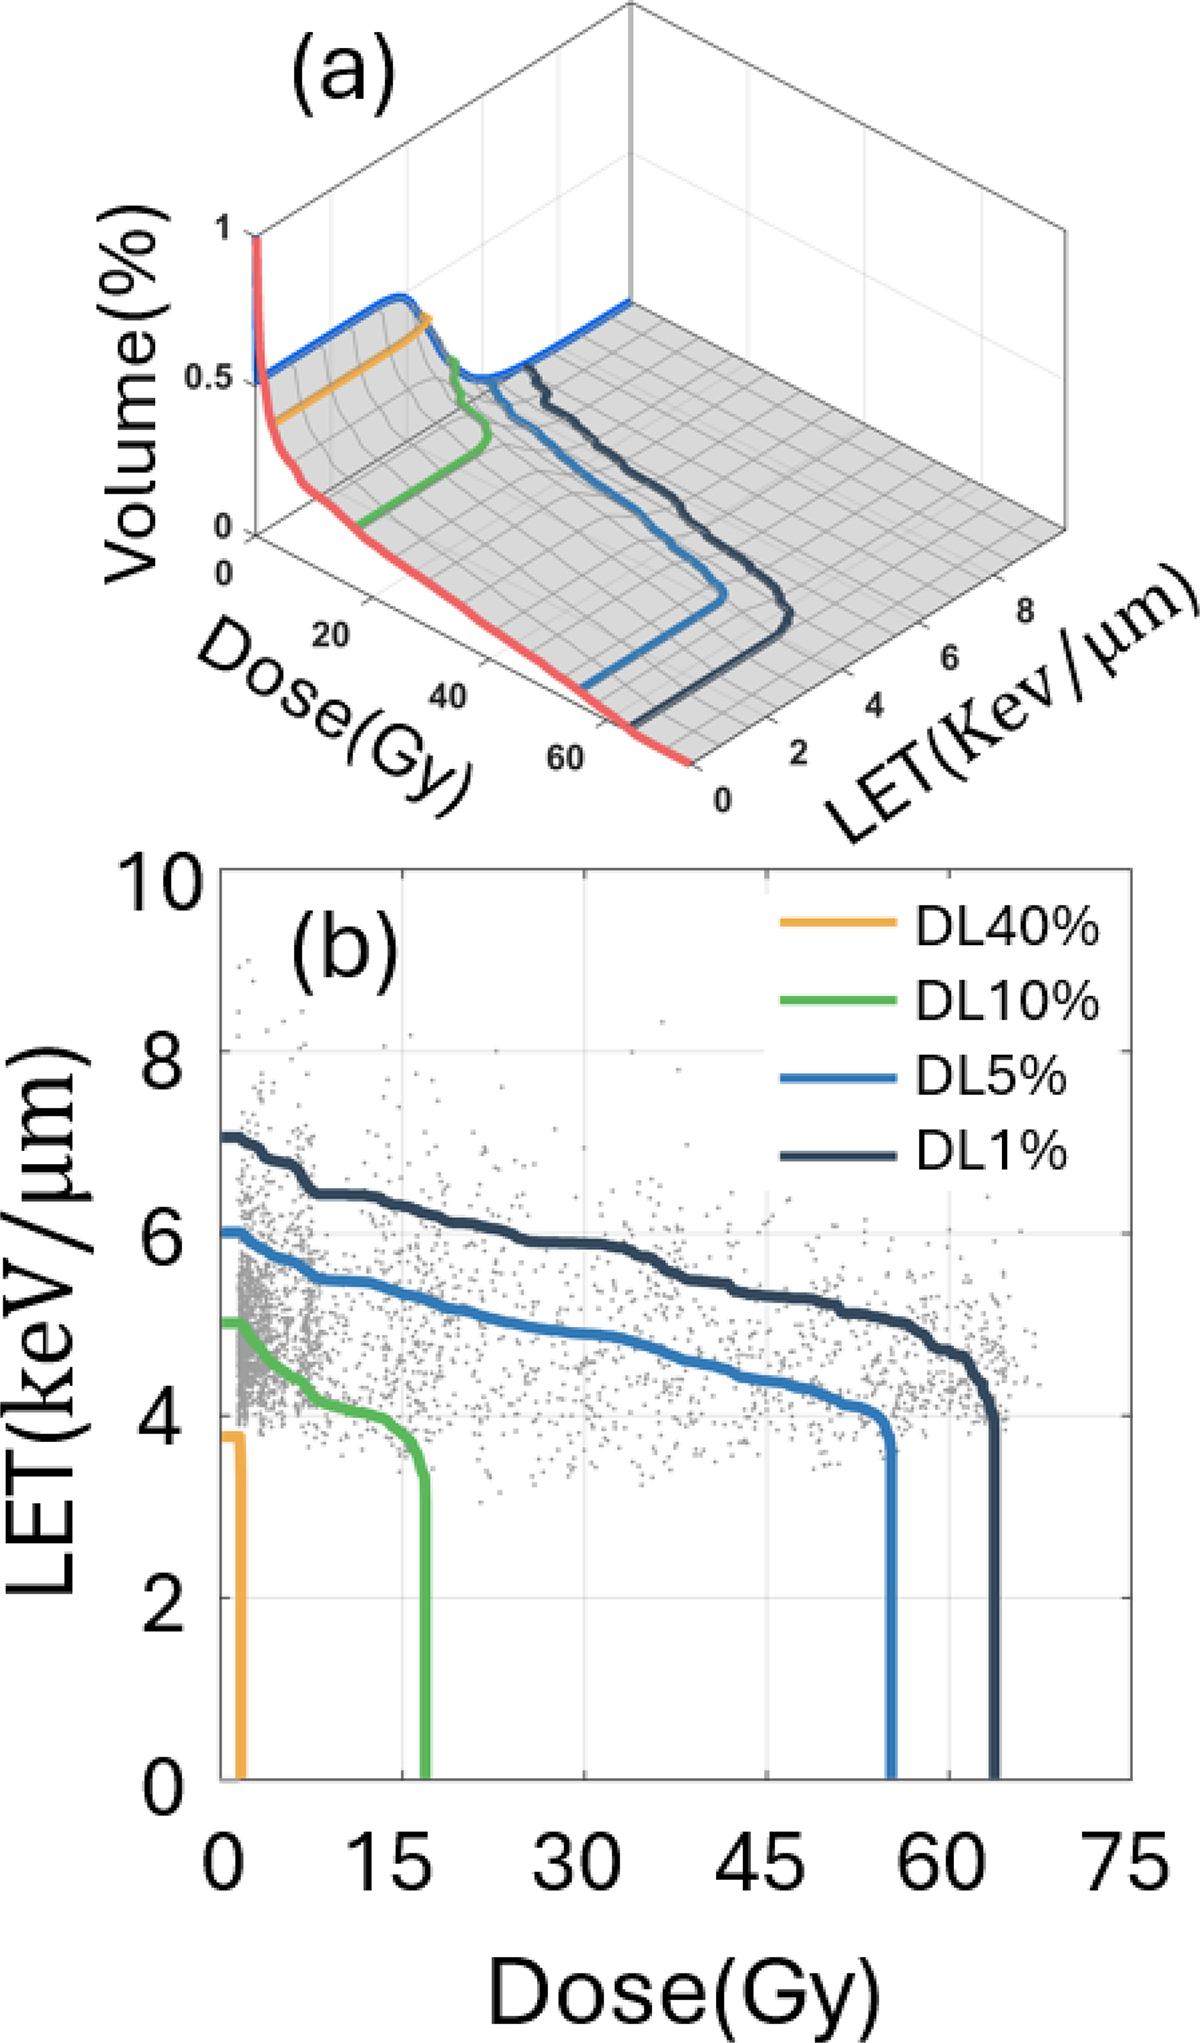
Sketches about the dose linear-energy-transfer (LET) volume histogram (DLVH). (a) Three-dimensional DLVH surface. The solid lines on the surface are the iso-volume contour lines DLν%. (b) The projected two-dimensional DLVH of (a) and the iso-volume contour lines. The gray dots represent the voxels of the structure.
Current usage metrics show cumulative count of Article Views (full-text article views including HTML views, PDF and ePub downloads, according to the available data) and Abstracts Views on Vision4Press platform.
Data correspond to usage on the plateform after 2015. The current usage metrics is available 48-96 hours after online publication and is updated daily on week days.
Initial download of the metrics may take a while.